Help Guide
Dashboard
The Dashboard is the first screen you will see upon logging in to ClientInsight. This
screen is user customizable. On the Dashboard, you will be able to see the data
stories and visuals that are meaningful to you.
ClientInsight relies on data sources to create visualizations, analyze data, and
ensure that you have the insights you need to drive outcomes. There is no limit to
how many data sources you can have in ClientInsight; the more diverse data you
have, the more you will able to do.
Filters
The main elements of the Dashboard are the Filters and the Visuals.
1 The Filters can be found at the top of the Dashboard and include the Source
System and Project Type . More filters may appear depending on your
selections.2 On the top
right-hand side, you can also customize your layout and Select
Visuals you would like shown (shown below).
Visuals
The other main element of the Dashboard are the Visuals. Each Visual tile is
interactive and linked to the other Visuals.
When you select a data point on one Visual, all the other Visuals will update as
well to reflect the selection and display the appropriate data.
There are additional filters on the Visuals themselves. As you hover your mouse
over a Visual tile, a small menu of icons will appear in the top right-hand corner.
Hovering your mouse over the Question Mark icon will give you a brief
explanation of what data is being shown.Filter icon will display which Filters and Slicers are affecting the
Visual.Focus Mode icon will enlarge the Visual and allow you an in-depth
view.Ellipses icon provide more options, include Export Data, Show as a
Table, and Sorting commands.
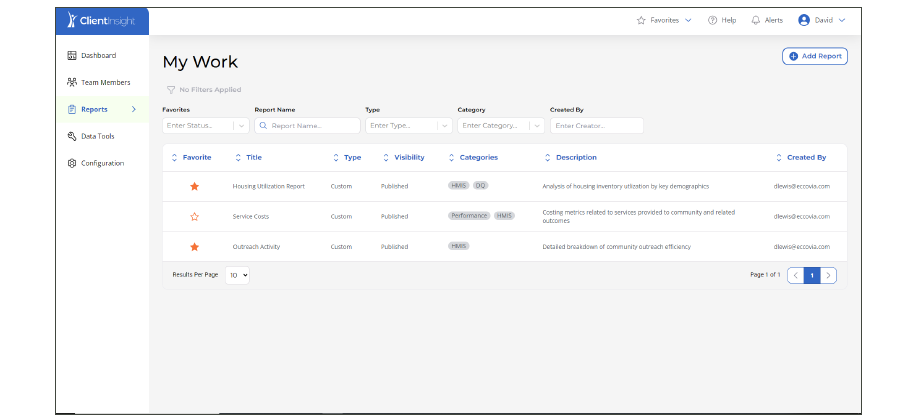
Reports
View Report
The Reports section of ClientInsight includes Reports , My Work ,
Community
Reports , and Public Reports .
The Filters displayed at the top of the page will help you sort through the reports.
These filters are dynamic and show results as you search.
Reset All Filters button.
Favorites allows you to view any reports you have favorited (or starred). When
you mark a report as a Favorite, that report will also appear in your list of
Favorites, accessible from the Favorites menu at the top of the page. These
Favorites are available from any page in ClientInsight. Report Name allows you to directly search for a report by typing the name into
the search bar.Type gives you the ability to sort between Standard or Custom reports.
Category allows you to search by Category, which is essentially a tag that you can
add to any report. It's possible to search by multiple categories at a time. You can
manage your categories in the Configuration section of ClientInsight.
Created By allows you to search for reports created by a specific person by typing
their name into the search bar.Favorites , Title ,
Type , Visibility , Categories ,
Description , Created By .
Selecting any report from the Reports page or Favorites list will navigate directly
to that specific report.
When viewing a report, there are filters at the top of the page to assist you in
locating the data you need. Selecting More in the upper right-hand corner will
populate additional filters you can utilize. You can select Reset All Filters in the
upper-right hand corner to return the page to its default state.
Adding a Report
If you would like to create a custom report, select Add Report from the top
right-hand corner. This will open the Report builder. The report authoring tool is
powered by Power BI, which you can leverage when building your reports. The
Team Member roles of Global Admin, Source System Admin, and Org Admin will
have access to this feature.
My Work is a private page where you can access any reports that you have
created. After saving your progress on a report, you have the option to Edit
Report , Publish Report , or Pin to Reports .
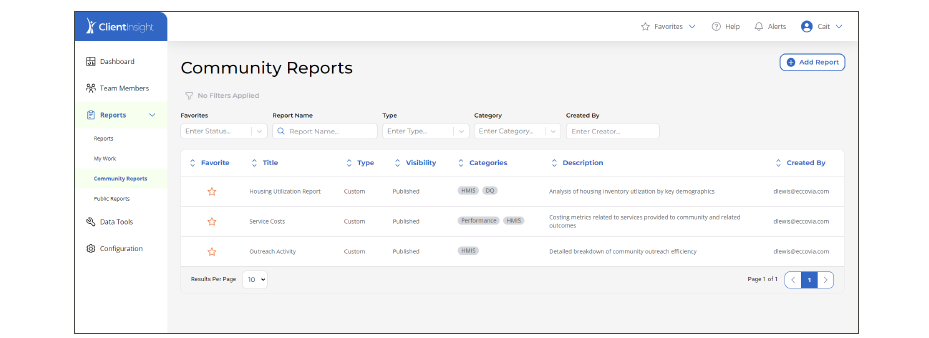
Community Reports contains all reports created by users within your instance
of ClientInsight. Once a report has been published by a member of your
organization, it will appear here.
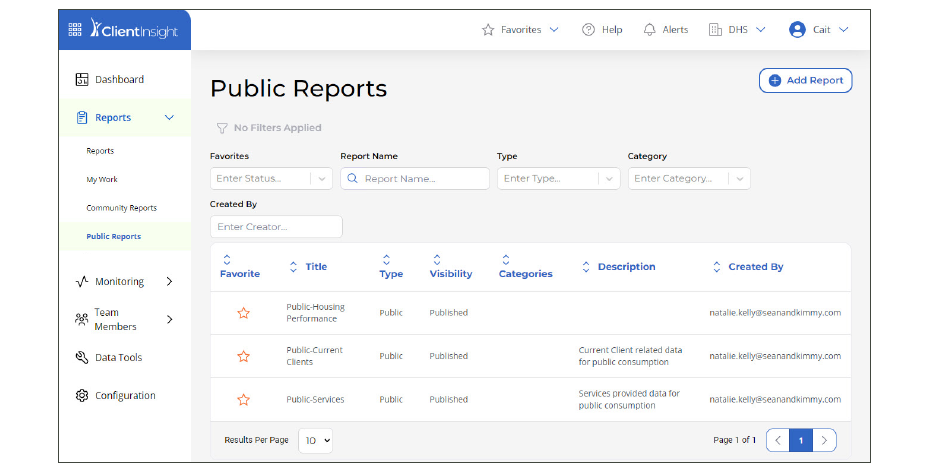
Public Reports
Public Reports are reports that have been published and made available for embedding in other applications or websites.
To have one of your reports converted to a public report, contact your administrator.
Monitoring
The Monitoring pages provide details on Batch Runs (data imports and exports), and Report Usage Metrics.
Batch Runs
The Batch Runs dashboard provides a window into the status and logging of the batch processes that
support importing and exporting ClientInsight data.
Report Usage Metrics
Provides a dashboard showing usage metrics like total views and views by date.
Team Members
The Team Members page displays all users who are registered in ClientInsight. A
designated administrator from your organization can manage Team Members, as
well as their access levels and status, from this page. All Team Members will be
shown, whether they are Active or Inactive.
You can view the Name , Role , Job Title , and
Status of each Team Member. It is also
possible to sort by each of these categories by selecting the category name at the
top of each column.
Adding a Member
To add a new Team Member, select Add Member in the top right-hand corner of
the screen.
A window will appear where you can enter basic information for the new
member, including Email Address , Name , Job Title ,
Role , Organizations , and Data
Sources .
The Role that is assigned to each user should be assigned depending on the
permissions you want to grant the user. The levels of access each user needs and
how they will be accessing data in the system are components to consider when
assigning Roles.
Definitions of each Role
Global Admin Source System Admin Org Admin Members
Once you have entered all required information and selected a role for the new
user, they will receive an email invitation to create their ClientInsight account.
Eccovia Users
Eccovia Users are Eccovia employees assigned to support and maintain your ClientInsight
application.
The Data Tools section is made up of three important features: Upload Files for
Ingestion , De-Duplicate Records and Link Records to
Unique Client Index .
These tools can be used together to help establish connections between data sets,
increase data accuracy, and improve client care.
This feature allows you to upload files for ingestion into the ClientInsight
data warehouse.
When the upload screen opens, select the appropriate Source System from the
drop-down list and then click on "Choose File" and select the ZIP file containing your
HMIS extract files.
Note: The files contained in the ZIP archive must be in compliance with the most current HUD CSV programming specifications or the later processing steps will fail.
The De-Duplication feature uses machine learning to evaluate your data and
duplicate client records.New Project on the De-
Duplicate
Records tile.
You will be guided through the process to set up a De-Duplication project.
First, Select Dataset by naming your project and choosing the Data Source.
The next step is Find Duplicates . In this step, the system will apply the machine
learning algorithms to find duplicates in the data.
In the Train System step, you will be presented with pairs of records that may be
duplicates. You will enter ten “Yes” answers and ten “No” answers in order to
teach the algorithm how to find more duplicates.
Refining Matches allows the software to refine based upon the system training
completed in step three.
Last, you can Review Results .
Once you start a new project, it will show up as a tile on the Data Tools page. If
you need to return to a project, you can select Resume Project .
Create Unique Client Index
Once you've de-duplicated your data sources and re-entered the data via your
source systems, you can then Link all matching data through each of your data
sources.
Configuration
The Configuration page is available to adminstrators and allows you to configure ClientInsight
to suit the need of your organization.
Report Categories
Add, edit, or delete custom categories that can be applied to your reports for easier sorting and
organization.
Data Quality Alerts
Configure data quality thresholds for sending email alerts to desired recipients when your data does not
meet
your standards. Administrators can set percentage based thresholds for both Missing and Unknown values. When
new
data is is added email alerts will be sent if the imported data elements exceed the configured data quality
thresholds.
Pulic Report Reviewers
The Public Report Reviewers page allows an administrator to configure ClientInsight to send in app alerts
to desired users when another user submits a public report for review before publishing.